Originally sent as SBI Dispatch #1 on 20 July 2026; it is No. 2 in this archive.
Reading No. 5817 · Scientific Bitcoin Institute · The founding letter
Dear reader,
If you're receiving this, you successfully signed up as a member of the Scientific Bitcoin Institute — which for a while was harder than it should have been. Our verification email system had a deliverability problem for several weeks, and we know some people who tried to sign up during that window never made it in. If someone you know mentioned they'd wanted to join us, please tell them the problem is fixed and they can try again at app.scientificbitcoininstitute.org/sign-up.
Now — what the Institute is, and what we've been building.
The Institute in one paragraph. The Scientific Bitcoin Institute is a 501(c)(3) nonprofit dedicated to the scientific study of Bitcoin. That means treating Bitcoin the way physicists treat any interesting phenomenon: with models, tests, precise language, and the willingness to be wrong. Most Bitcoin coverage today is either promotional (from people who benefit if the price goes up) or dismissive (from people who don't understand it). Both miss the actual question: what does Bitcoin look like when we measure it seriously?
What today looks like, measured seriously.
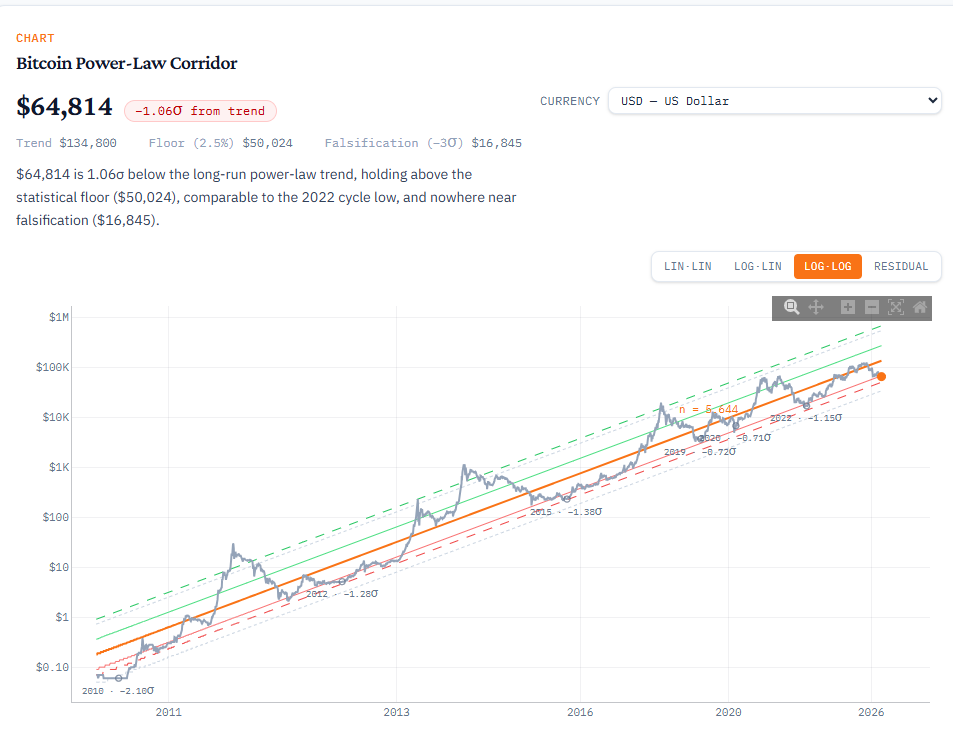
As of this letter, Bitcoin is at approximately $63,000, which is −1.09σ below the long-run power-law trend for its price history. That's genuinely low — comparable to the depth of the 2022 cycle low. It sits well above the statistical floor at approximately $49,800 and nowhere near the falsification level of $16,700, at which the power-law hypothesis would need to be reconsidered.
The wider market is in the middle of a familiar cycle debate. Bernstein maintains a $150K year-end target. Citigroup cut theirs from $112K to $82K. Standard Chartered holds at $100K. Prediction markets give 68% odds of $65K by end of July, but only 20% odds of $90K by year-end. ETF outflows continue — the funds bled $4.5B in June, their worst month since launch — and the Fed meets July 28-29 with markets pricing a 70% chance of a hold.
None of this changes the underlying model. When Bitcoin is at −1σ from a 16-year power-law trend, that's the normal deep-cycle position. It has happened repeatedly (2015, 2019, 2020, 2022). Every one of those cycle lows sat closer to the falsification threshold than today's price. The model has never been falsified.
That's what the Institute publishes: not price predictions, but calibrated distance from a well-tested reference point.
What we're building.
The Journal. The Journal chronicles our work outside the dashboard — the conferences we attend, the talks we give, and the ways we spread scientific Bitcoin knowledge to a wider audience. scientificbitcoininstitute.org/news/journal.
The Manifesto. Our stated positions on Bitcoin's role in the monetary and technological landscape. Read it at scientificbitcoininstitute.org/manifesto#mission.
The Reader Dashboard. Free for every signed-up member, this is our public research artifact: the Bitcoin Power-Law Corridor with 16 currencies (including gold and silver), a historical cycle-lows table, and a preview of what's coming for supporter tiers. Available at app.scientificbitcoininstitute.org after you sign in.
The Observatory (coming soon). A more comprehensive research terminal in preparation for later this summer. It will include multiple regression methods applied to the same Bitcoin price data (quantile regression is already implemented, Bayesian regression coming next), a Sornette LPPL bubble-detection instrument, on-chain analytics from Newhedge including hash rate and holder cohorts, and comparison views showing Bitcoin priced in gold, silver, and inflation-affected currencies.
The Supporter tier (opening soon). For those who want to fund open Bitcoin research and receive additional indicators, member essays, and access to the full Observatory. All contributions are tax-deductible under our 501(c)(3) status.
How to read the Corridor.
This is our simplest indicator, but also our most important. The math is straightforward: fit a straight line to log(price) vs log(days since Bitcoin's genesis). The result is what physicists call a power-law relationship — the same class of relationship that describes how populations of cities scale, how brain neurons grow, and how volcanic eruptions distribute in size.
For 16 years, Bitcoin has fluctuated around this line with remarkable consistency. The corridor is defined by the statistical distribution of those fluctuations. When price is at −1σ from trend, that's the 16-year historical bottom band. When it's at +2σ, it's approaching the top of the corridor. When it approaches −3σ, the model would be facing genuine falsification pressure.
The model doesn't say "Bitcoin will go up." It says: "given 16 years of history, this is where the model expects Bitcoin to sit, and this is how far it typically deviates." That's a fundamentally different claim than what most Bitcoin analysis makes.
Coming this month.
- The Fed's July 28-29 meeting — we'll publish a brief note before and after
- A first Historical Accuracy analysis for the Corridor — how well the model has held up over rolling windows since 2015
- Sign-ups for the Supporter tier open shortly, with a tax-deductible contribution structure appropriate for donor members
If you find our approach interesting, please: sign in at the dashboard, read the Manifesto, and tell someone else. Word of mouth is what will grow this Institute.
Warmly,
Giovanni Santostasi
Director, Scientific Bitcoin Institute
Reading No. 5817 · scientificbitcoininstitute.org · app.scientificbitcoininstitute.org
Not a licensed financial advisor. Nothing in this letter is investment advice.