Strategy Inc. — the company once known as MicroStrategy (Nasdaq: MSTR) — is the largest corporate holder of Bitcoin on earth. But the most interesting thing about it isn't the size of the pile. It's that a mid-sized software firm has built, in plain sight, an entire layer of financial infrastructure around Bitcoin: common stock, preferred shares, and convertible bonds engineered to raise capital, accumulate Bitcoin, and grow the amount of Bitcoin behind every share. In doing so it has quietly handed Bitcoin exposure to people who would never open a crypto wallet.
That is the through-line of this explainer. We cover what the machine is and why someone would buy a share of it instead of buying Bitcoin; how the accretion flywheel works; where the dividend cash comes from; why the "Ponzi" label doesn't hold up legally; and — the heart of the bullish case — why building real financial plumbing around Bitcoin is a genuine maturation event that expands the universe of buyers. We then examine the long-run trajectory through the Bitcoin power law, drawing on the Scientific Bitcoin Institute's own research (a 2026 preprint), show why the structure's biggest risk fades with time, and finish with references and a glossary. Charts illustrate the mechanism and the trend.
Nothing here is financial advice. Every figure is illustrative and reflects conditions as of mid-2026; prices, rates, and balance-sheet details change constantly.
1. What Strategy actually is
Underneath the Bitcoin story, Strategy still runs a legacy business-analytics software operation. But its identity today is a financial structure: a single Bitcoin reserve financed by a deliberately layered "capital stack." Each layer is a different security aimed at a different kind of investor, in order of who gets paid first if the company is ever wound down.
From safest (paid first) to riskiest (paid last):
| Layer | What it is | Risk / reward |
|---|---|---|
| Convertible notes | Corporate debt, often near-0% interest, convertible into MSTR shares | Safest; first in line |
| STRF ("Strife") | Senior perpetual preferred, ~10% cumulative dividend, cash | Conservative income |
| STRK ("Strike") | Convertible preferred; ~8% plus equity upside if MSTR soars | Income + option |
| STRC ("Stretch") | Variable-rate perpetual preferred; rate adjusts monthly to hold ~$100 | Bond-like, money-market style |
| STRD ("Stride") | Junior preferred, ~10% non-cumulative dividend | Higher yield, higher risk |
| MSTR common | Ordinary ownership stock; votes; unlimited upside | Last in line; highest risk/reward |
The whole arrangement is what people mean by a Bitcoin-backed yield curve: one underlying asset, sliced into instruments that trade safety against upside — a structure that looks a lot like the bond-and-equity stack of any mature company, only with Bitcoin as the reserve asset.
2. Why buy MSTR instead of just buying Bitcoin?
If you simply want Bitcoin exposure, you can buy Bitcoin. So why own a company that holds it? Three reasons:
-
Leverage. Strategy uses debt and preferred stock to control more Bitcoin than its own cash could, so the stock has historically moved more than Bitcoin in both directions — at times several times as much. Amplified upside is the appeal.
-
The accretion flywheel. When the stock trades above the value of its Bitcoin, the company can issue shares at that premium, buy more Bitcoin, and raise the Bitcoin-per-share that existing holders own — something no passive vehicle can do.
-
Access and convenience. MSTR sits in any ordinary brokerage or retirement account, no exchange, wallet, or private keys required — plus a deep options market on top.
The honest framing: buying MSTR is Bitcoin multiplied by leverage, by a premium multiple, and by management's capital-markets execution. When those align, it can outpace Bitcoin handsomely; when they reverse, it falls faster. That second half is the risk — and, as we'll see, it is the part that shrinks as Bitcoin grows.
3. The flywheel, with numbers
The flywheel only works at a premium. Here is the whole mechanism in one example. Start with a simple company: 100 shares, 100 BTC, Bitcoin at $100,000 — so Bitcoin-per-share is 1.0. The company issues 10 new shares and spends every dollar on Bitcoin. What happens to Bitcoin-per-share depends entirely on the price the stock fetches when it sells.
| Scenario | Stock price | Cash raised → BTC bought | New BTC / share | Result |
|---|---|---|---|---|
| Premium (mNAV 2.0) | $200,000 | $2.0M → 20 BTC | 120 / 110 = 1.09 | Accretive ↑ |
| At NAV (mNAV 1.0) | $100,000 | $1.0M → 10 BTC | 110 / 110 = 1.00 | Neutral → |
| Discount (mNAV 0.8) | $80,000 | $0.8M → 8 BTC | 108 / 110 = 0.98 | Dilutive ↓ |
Selling overvalued stock to buy Bitcoin is the magic — and it only works while the stock trades above its Bitcoin. This is what Michael Saylor meant at BTC Prague 2026 when he told Jack Mallers, "The idea that selling equity is dilutive is a misnomer": above NAV, each raise genuinely grows Bitcoin-per-share. The discipline the model demands is to issue when the premium is fat and lean on lower-cost capital when it isn't.
4. Where the dividend money comes from
The preferred dividends are large and fixed in dollars — on the order of a billion dollars a year across the stack — while the legacy software business throws off only around $100 million. The gap is covered, in order of importance, by:
-
New capital raises — the dominant source. At-the-market sales of MSTR common and of more preferred shares. For STRC in particular, the same raise funds both the Bitcoin purchase and the dividend.
-
A multi-billion-dollar USD cash reserve, built specifically to cover preferred dividends and interest.
-
Selling a sliver of Bitcoin when needed — a small first sale was disclosed in mid-2026 to fund preferred dividends.
Critics call the circularity "Ponzi-like." But notice the bullish counterpoint that the rest of this article develops: as Bitcoin appreciates, that billion-dollar obligation becomes a rounding error against a multi-hundred-billion-dollar reserve, and the dependence on fresh capital fades. The funding question is acute today and trivial later.
5. "Is it a Ponzi?" — and why regulators allow it
A Ponzi scheme is defined by fraud and concealment, not by funding distributions with new money (closed-end funds and others do versions of that legally). By the legal test, Strategy is not a Ponzi: it holds hundreds of thousands of real, audited Bitcoin that can appreciate on their own; it discloses everything in SEC filings and audited statements; and its dividends are board-declared and conditional, not fabricated guarantees.
Regulators "allow" it because U.S. securities law is disclosure-based, not merit-based: the SEC ensures investors get complete, accurate information, then lets them decide. Every building block — common stock, preferred stock, convertibles, at-the-market offerings — is a decades-old, perfectly legal instrument. The Ponzi comparison captures a real solvency question, but mislabels it as fraud, which — given the disclosure and audits — is precisely what it is not.
6. The bigger picture: building financial infrastructure around Bitcoin
Step back from any single ticker and the more durable story comes into view. What Strategy and its imitators are really doing is wrapping Bitcoin in the familiar machinery of traditional finance — equity, credit, dividends, ratings, disclosure — and that wrapping is itself a maturation event with real benefits.
Why the infrastructure itself matters
For most of its life Bitcoin offered exactly one thing: price exposure. No coupon, no yield, no fixed-income profile — just a volatile spot price you had to custody yourself. The arrival of regulated custody, institutional-grade trading, and standardized reporting has steadily removed the operational barriers that once kept large allocators out. On top of that plumbing, instruments like Strategy's preferreds begin to do something new: they turn a non-yielding asset into a source of income. Analysts have gone so far as to suggest that a maturing "Bitcoin yield" could eventually function as a parallel reference rate alongside the Treasury curve — a sign of an asset moving from speculation toward a standard portfolio building block.
Reaching the people who will never touch Bitcoin
This is the crux of the bull case, and it is often missed. A huge pool of capital is structurally unable or unwilling to hold Bitcoin directly: retirees and income funds that need a yield, conservative mandates that forbid commodities or crypto but permit equities and preferred stock, institutions that can't self-custody, and ordinary savers who find wallets and private keys intimidating. A dividend-paying, exchange-listed preferred share backed by Bitcoin meets all of those investors where they already are.
The evidence that this expands the audience is concrete. Strategy's management has noted that its Stretch (STRC) preferred is held overwhelmingly by retail investors — a base distinct from the largely institutional holders of MSTR common — so the company captures two different kinds of demand without one cannibalizing the other. Across the sector, treasury companies have raised billions in high-yield preferred specifically to court fixed-income investors who want regular income rather than direct exposure to a volatile coin. Bitcoin's own co-architect, Adam Back, has argued that these recurring, structured buyers, layered on top of new institutional and wealth-management demand, will in time overwhelm the sellers.
The strategic point: every dollar that reaches Bitcoin through a preferred share, an ETF, or a treasury company is a dollar that would otherwise have stayed on the sidelines. Wrapping Bitcoin in instruments people already understand grows the total addressable market for the asset — a demand tailwind that compounds as the infrastructure deepens.
How this differs from a spot Bitcoin ETF
Spot ETFs (BlackRock's IBIT, Fidelity's FBTC, and peers) were a landmark in their own right, and for many investors they are the right tool. But they and treasury companies are different instruments, not competitors for the same job. The table makes the contrast concrete.
| Feature | Spot Bitcoin ETF | Treasury company (e.g., MSTR) |
|---|---|---|
| Exposure | Clean ~1:1 to spot Bitcoin | Leveraged, amplified — can move 2–5x |
| Price vs. NAV | Trades near NAV via creation/redemption arbitrage | Premium or discount, set by sentiment (no redemption) |
| Bitcoin per share | Fixed — cannot grow | Can grow over time via accretion ("BTC Yield") |
| Income / yield | None | A whole menu of dividend-paying preferreds |
| Cost | Low expense ratio (~0.12–0.25%) | No direct fee; cost is premium + dilution + credit risk |
| What it is | A passive fund holding coins | An operating company with a capital structure |
The decisive difference for the access story is income. An ETF can only ever hand you Bitcoin's price; it cannot pay a Bitcoin-backed dividend. A treasury company can — and that single feature unlocks the income-oriented and conservative capital an ETF cannot reach. In practice the two are complements: a common framework pairs a low-fee ETF core for clean exposure with a smaller treasury-company satellite for amplified upside and yield. Together they widen the on-ramps to Bitcoin far more than either could alone.
7. The long view: the Bitcoin power law
To think about where this leads over decades, we need a model of Bitcoin's long-run price. The most rigorously tested one is the Bitcoin power law, which holds that price grows as a power of time, P(t) ∝ t^β. This is not a casual chart-fitting exercise: in a Scientific Bitcoin Institute preprint (Santostasi & Perrenod, 2026, available on Zenodo), the exponent β = 5.69 ± 0.05 is measured across 5,696 daily observations spanning 2010–2026, with the log-residuals stationary and showing no secular drift over fifteen years.
Why the exponent isn't arbitrary
The central scientific result is that the exponent is derived rather than fitted. It factorises into two independently established mechanisms: how fast the network adds users, and how value scales with users.
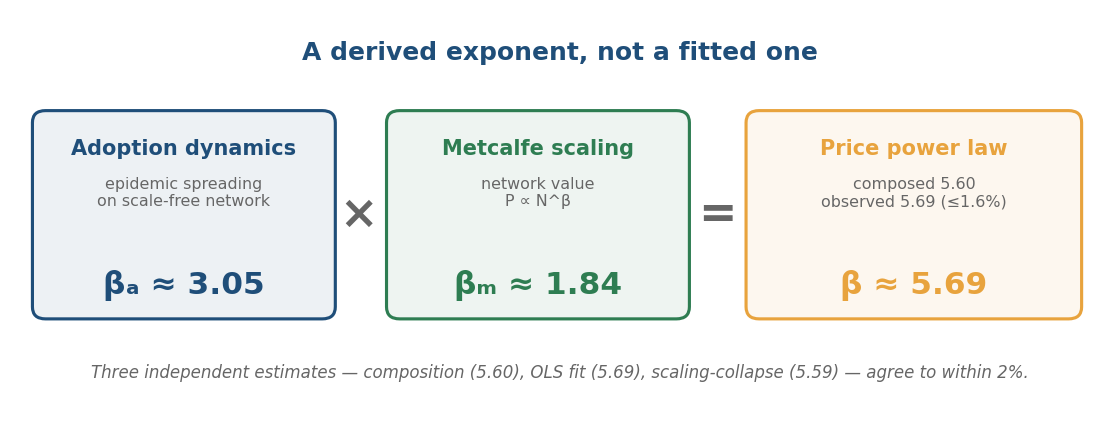 Chart 1 — The exponent is a product of two known scaling laws, not a free parameter.
The first factor, βₐ ≈ 3.05, is the adoption exponent: the count of active Bitcoin addresses grows as roughly t³. That cubic growth is the signature of epidemic spreading on a heterogeneous, scale-free network — the same mathematics that produced cubic growth in the early AIDS epidemic, where a "saturation wave" moves from highly-connected hubs out to less-connected tiers. The second factor, βₘ ≈ 1.84, is a generalised Metcalfe's law: a network's value scales with about the 1.84 power of its user count (between linear and the classic N²). Their product, 3.05 × 1.84 ≈ 5.60, matches the directly measured 5.69 to within 1.6%.
Why it's a scaling law, not just a straight line
A fair objection to any log-log fit is that taking logarithms can make almost any rising series look linear. The paper meets that objection head-on with tests that a mere fit would fail. A multi-asset comparison applies the identical method to Bitcoin, the NASDAQ, the S&P 500, and gold: Bitcoin alone shows true scale invariance (no preferred timescale), while the others curve — steep over short horizons, flat over long ones. A direct "collapse" test built from thousands of price ratios (which are immune to any shared trend) recovers the same exponent, 5.59. Formal econometrics agree: stationarity tests confirm the relationship is trend-stationary rather than spurious, and a model fitted only through 2020 predicts 2021–2026 with every out-of-sample point landing inside its expected band.
Crucially, this does not deny Bitcoin's wild cycles. In this framework the bull-and-bust swings are mean-reverting deviations around a long-run attractor — oscillations of roughly ±0.30 dex (about a factor of two either way), correlated with the four-year halving cycle. The power law is the spine; speculation is the wobble around it.
The trajectory and what it means for Strategy
 Chart 2 — The power-law trajectory on the paper's own fit, with the cyclical band. Markers show the central line.
Extended forward on the paper's own coefficients, the central trajectory runs from roughly six figures today toward the multi-million-dollar range by the mid-2040s — on the order of $8–10 million per coin — with the shaded band reminding us that any given year can sit a factor of two above or below the line. Run that through the Strategy machine and the implication is stark: the fixed, dollar-denominated obligations that look heavy today become negligible against a reserve heading toward the hundreds of billions and then trillions. The preferreds become rock-solid and the solvency critique dissolves.
One nuance keeps the analysis honest: as Bitcoin matures along this trend, the premium that supercharges MSTR common can compress, so the leveraged equity may not capture the full multiple even as the coins do. The bonds and preferreds, by contrast, simply get safer. A balanced way to express a power-law thesis is therefore to hold Bitcoin (or a spot ETF) for the clean upside and Bitcoin-backed preferreds for durable, increasingly well-covered income.
The cohort cascade: how treasury companies feed the law
Here the two halves of this article meet. Among the economic feedback loops the paper offers as candidate drivers of the trend is a cohort cascade: early individual holders progressively sell into demand from larger, better-capitalised entrants — first institutions and corporate treasuries, more recently spot ETFs and even sovereigns. Because each successive tier commands greater resources, the marginal coin changes hands at a steadily higher price, and that rising price draws in the next, larger class of buyer.
Strategy and its peers are not separate from the power law in this picture — they are part of its machinery. The financial infrastructure of Section 6 (dividend-paying preferreds, listed wrappers, credit instruments) widens the cascade by pulling in income-oriented and conservative capital that would never hold a coin directly. More participants feed the Metcalfe channel, P ∝ N^1.84, which feeds price. The "access" story and the "scaling law" story are the same phenomenon seen from two sides: building plumbing around Bitcoin is one of the mechanisms by which the network's value compounds.
8. The risk that fades with time
The structure's real vulnerability has never been the long-run average — it is surviving the troughs along the way. The same research that establishes the power-law trend also quantifies the cycles around it: deviations of roughly ±0.30 dex, a factor of about two in either direction, tied to the four-year halving rhythm. A drawdown of that size is a normal, expected feature of the attractor — but Strategy's debt maturities and dividends are fixed in dollars and do not wait for mean reversion. The reassuring part is that this risk is front-loaded: the same appreciation the trend implies steadily de-levers the balance sheet.
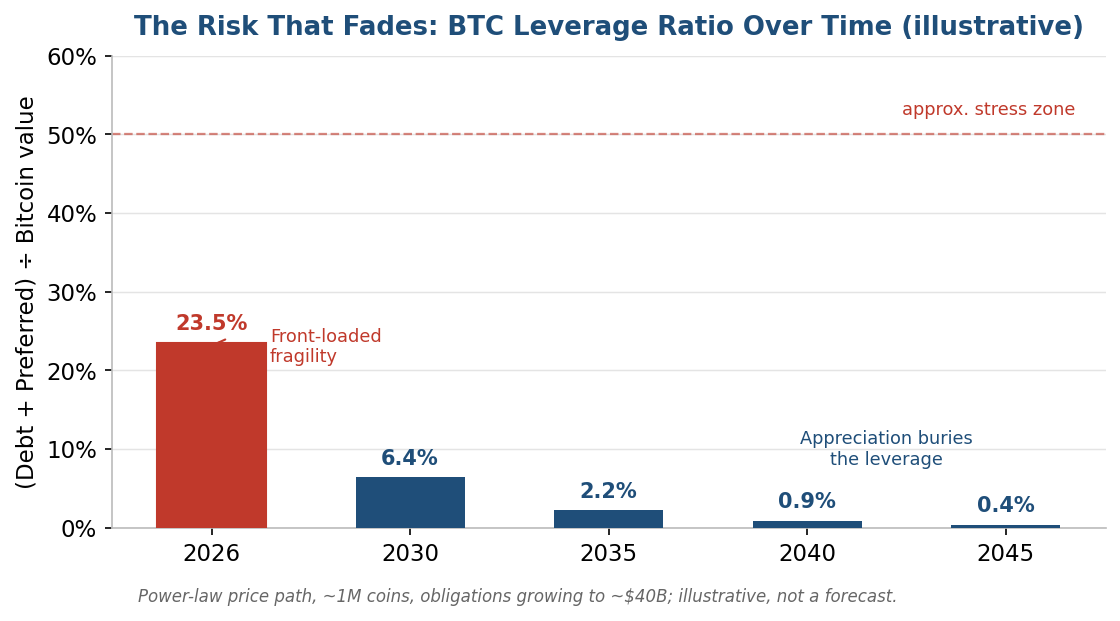 Chart 3 — As Bitcoin appreciates along the trend, obligations shrink relative to the reserve; the leverage ratio collapses toward irrelevance.
The mechanism of a bad trough is worth understanding so its limits are clear. If a deep cyclical drawdown coincided with a wall of maturing convertibles while the stock traded below NAV, Strategy could be forced to sell Bitcoin into a falling market to meet obligations — selling that pressures the price, compresses the premium further, and feeds on itself. Cumulative preferred dividends can be deferred without a formal default, which provides a shock-absorber, but persistent stress would impair the common equity.
| Era | Approx. BTC price | Obligations vs. reserve | Drawdown survivability |
|---|---|---|---|
| Today / near term | $60k–$150k | A meaningful slice (~20%+) | Fragile — a deep cyclical trough is the real danger |
| Mid term | $300k–$1M | Shrinking fast (single digits) | Resilient — buffer growing |
| Long term (on trend) | ~$8–10M by mid-2040s | A rounding error (<1%) | Effectively bulletproof on solvency |
In other words, Strategy faces a "valley of death" in the near term and becomes progressively bulletproof if it survives long enough for appreciation to bury the leverage. Management has built exactly the tools — a cash reserve, deferrable dividends, near-zero-coupon convertibles, and perpetual (no-maturity) preferreds — to widen that valley and improve the odds of crossing it. Survivorship is the whole game, and the structure is engineered to win it.
9. The likely endgame
If Strategy crosses the valley, the most coherent twenty-year trajectory is a metamorphosis into a leveraged Bitcoin reserve institution — a giant balance sheet financing a yield curve of fixed-income products. That is essentially Michael Saylor's "Bitcoin bank" vision, and his roughly $13-million-per-coin long-term target is broadly power-law-consistent. In that end state the company becomes the largest and most trusted Bitcoin-backed credit issuer on the planet, with the preferreds functioning as high-grade, Bitcoin-collateralized income and the common as a lower-beta proxy on an enormous reserve.
The constructive synthesis: wrapping Bitcoin in real financial infrastructure is good for Bitcoin — it widens access, deepens demand, and turns a volatile spot asset into something retirees, institutions, and income investors can actually hold. If the power law holds, owning Bitcoin and owning Strategy's Bitcoin-backed credit both look strong; the leveraged common offers the biggest upside for those willing to ride the volatility through the valley of death. The model is bold and genuinely risky in the near term, but it is engineered, disclosed, and — with time and appreciation — self-reinforcing.
And the caveats remain, stated plainly. The power law is a robust empirical regularity with a mechanistic basis, but it is an inference from one network's history, not a guarantee: the authors themselves note that the address-count proxy has limits and specify falsifiability conditions under which the relation would break. Leverage cuts both ways, and surviving the cyclical troughs is the single biggest variable for the equity. None of this is a forecast, and none of it is investment advice.
References
Selected sources, reflecting reporting and data available as of mid-2026. Figures in the article are illustrative and rounded for clarity. The power-law sections draw on the Institute's own peer-reviewed research, cited first.
-
Santostasi, G. & Perrenod, S. — "A Mechanistic Derivation of the Bitcoin Price Power Law: Network Adoption Dynamics and Generalised Metcalfe Scaling," preprint, Zenodo (2026). DOI 10.5281/zenodo.19387099 — https://doi.org/10.5281/zenodo.19387099
-
The Block — "What are Strategy's products? From STRK to STRC explained" — https://www.theblock.co/learn/394455/what-are-mstr-strk-and-strc-strategys-stock-and-preferred-shares-explained
-
Bitcoin Magazine Pro — "STRC Explained" — https://www.bitcoinmagazinepro.com/strc-explained/
-
OAK Research — "STRC: How Strategy Turned Bitcoin Into a Yield Product" — https://oakresearch.io/en/analyses/fundamentals/strc-how-strategy-turned-bitcoin-into-a-yield-product
-
FinTech Weekly — "Institutional Portfolios Need New Yield Sources — and Bitcoin Delivers" — https://www.fintechweekly.com/magazine/articles/institutional-portfolios-bitcoin-yield-new-income-sources
-
CoinDesk — "Institutional money is coming for bitcoin (Adam Back)" — https://www.coindesk.com/business/2026/04/29/institutional-money-is-coming-for-bitcoin-but-adam-back-says-it-moves-slower-than-you-think
-
Traders Union — "Crypto treasury companies turn to high-yield preferred equity" — https://tradersunion.com/news/financial-news/show/2181165-crypto-treasury-preferred-equity-yield/
-
TECHi — "MSTR vs Bitcoin 2026: The 5x Leverage Trade Explained" — https://www.techi.com/mstr-bitcoin-leverage-trade/
-
heyGoTrade — "Bitcoin Treasury Stocks vs Spot Bitcoin ETFs: Allocation Framework" — https://www.heygotrade.com/en/blog/bitcoin-treasury-stocks-vs-spot-btc-etfs/
-
KuCoin — "What Differentiates MicroStrategy's Bitcoin Strategy from BlackRock's IBIT ETF?" — https://www.kucoin.com/blog/ae-what-differentiates-microstrategy-bitcoin-from-blackrock-ibit-etf
-
BitMEX Blog — "MicroStrategy vs Bitcoin: Which to Trade in 2026" — https://www.bitmex.com/blog/microstrategy-bitcoin
-
VanEck — "Deconstructing Strategy (MSTR): Premium, Leverage, and Capital Structure" — https://www.vaneck.com/us/en/blogs/digital-assets/matthew-sigel-deconstructing-strategy-mstr-premium-leverage-and-capital-structure/
-
CoinDesk — "Saylor and Mallers go toe-to-toe over Strategy's reporting metrics" — https://www.coindesk.com/markets/2026/06/11/michael-saylor-and-jack-mallers-go-toe-to-toe-over-strategy-s-bitcoin-reporting-metrics
-
Datos Insights — "Bitcoin Institutional Adoption: How Regulatory Clarity Unlocks Capital" — https://datos-insights.com/blog/bitcoin-etf-institutional-adoption/
-
CCN — "Is Strategy (MSTR) the Next Bitcoin Ponzi? Explained" — https://www.ccn.com/education/crypto/is-strategy-mstr-the-next-bitcoin-ponzi-explained/
-
Cointelegraph (via TradingView) — "How the 'Power Law' model got to $10M Bitcoin by 2045" — https://www.tradingview.com/news/cointelegraph:1fe2b5eeb094b:0-physicist-explains-how-his-power-law-model-got-to-10m-bitcoin-by-2045/
-
Giovanni Santostasi — "The Bitcoin Power Law Theory" (Medium) — https://giovannisantostasi.medium.com/the-bitcoin-power-law-theory-962dfaf99ee9
Glossary of terms
Every technical term used in this article, in plain language.
NAV (Net Asset Value)
The value of what a company holds — for Strategy, mostly its Bitcoin. ("NAV" is technically a regulated-fund term; Strategy's filings concede its "BTC NAV" isn't equivalent to a fund's NAV.)
mNAV (multiple-to-NAV)
Enterprise value ÷ Bitcoin NAV. Above 1.0 = a premium; below 1.0 = a discount.
Enterprise value
The market's price tag on the whole company: market cap, plus debt, plus preferred, minus cash.
Premium / discount to NAV
How much more (premium) or less (discount) the market values the company than its underlying Bitcoin.
Accretive vs. dilutive
Accretive raises a per-share metric (here, Bitcoin-per-share); dilutive lowers it. Issuing shares above NAV is accretive; below NAV, dilutive.
BTC Yield
Strategy's metric for the percentage growth in Bitcoin-per-share over a period — the scoreboard for whether the flywheel is working.
ATM offering (at-the-market)
Selling new shares gradually into the open market at prevailing prices; Strategy's main way of raising cash.
Leverage
Using borrowed money or preferred capital to control more of an asset than your own cash could — amplifying gains and losses.
Amplification
Strategy's preferred term for its total leverage — convertible debt plus preferred equity measured against the Bitcoin reserve.
Beta
How much one thing moves relative to another. A 5x beta to Bitcoin means it tends to move about five times as much.
Convertible debt (convertible note)
A loan the lender can convert into a fixed number of shares. A bond plus an embedded stock option; often carries a very low interest rate.
Out of the money / in the money
A convertible is "out of the money" when the share price is below its conversion price (behaving like plain debt) and "in the money" when above (holders convert to equity).
Common stock
Ordinary ownership. Carries votes and unlimited upside, but sits last in line — paid only after debt and preferred.
Preferred stock
A hybrid between debt and common: a fixed/stated dividend paid before common, priority over common in a wind-down, usually no votes, limited upside (unless convertible).
Cumulative vs. non-cumulative dividend
A skipped cumulative dividend compounds until paid (STRF, STRC); a skipped non-cumulative one is simply gone (STRD).
Perpetual preferred
A preferred share with no maturity date — it pays dividends indefinitely rather than being repaid on a set date. A key shock-absorber, since there is no principal due.
Capital stack / liquidation waterfall
The order in which claims are paid in a wind-down: bondholders first, then preferred, then common. Higher = safer but less upside.
Spot Bitcoin ETF
A passive fund (e.g., IBIT, FBTC) holding actual Bitcoin and tracking its price ~1:1, kept near NAV by a creation/redemption arbitrage mechanism.
Creation / redemption (arbitrage)
The process that lets authorized participants swap ETF shares for the underlying asset, keeping an ETF's price tightly tied to NAV. Treasury companies lack this, so they trade at a premium or discount.
Tracking error
How far a fund's return drifts from the asset it aims to track. Spot Bitcoin ETFs have very low tracking error.
Bitcoin yield curve / reference rate
The emerging set of Bitcoin-backed income instruments at different risk levels; analysts speculate it could one day act as a benchmark alongside the Treasury curve.
Digital Asset Treasury (DAT)
A public company whose primary strategy is holding a crypto asset (here, Bitcoin) on its corporate balance sheet.
Death spiral / reflexivity
A self-reinforcing feedback loop. Downward: forced sales push price down, worsening the balance sheet, forcing more sales. Upward: rising price draws adoption, which (via Metcalfe) lifts price further.
Bitcoin power law
The empirical relation P(t) ∝ t^β with β ≈ 5.69, measured over 2010–2026. In Santostasi & Perrenod (2026) the exponent is derived as β_A × β_M (adoption × Metcalfe), not fitted, and validated by scale-invariance and out-of-sample tests.
Scaling law / scale invariance
A relationship with no preferred timescale: the same dynamics govern price ratios over one year as over five. Bitcoin exhibits this; conventional assets (stocks, gold) do not.
Adoption exponent (β_A ≈ 3)
The power governing how the active-address count grows in time, N(t) ∝ t³ — the cubic signature of epidemic spreading on a heterogeneous, scale-free network (a "saturation wave" from hubs outward).
Metcalfe's law (β_M ≈ 1.84)
Network value scales with a power of the user count. Classic Metcalfe is N²; Bitcoin's measured ~1.84 sits just below, reflecting the declining marginal value of each new connection.
Long-run attractor
The stable trend a system returns to after deviations. Here the power law is the attractor; bull-and-bust cycles are mean-reverting wobbles (≈±0.30 dex) around it.
Cohort cascade
A demand feedback loop in which each tier of holder (individuals → institutions → corporate treasuries → ETFs → sovereigns) sells to a larger, better-capitalised next tier, ratcheting price upward over time.
Self-organized criticality
A property of complex systems that naturally evolve toward a critical, scale-invariant state producing power-law behaviour — the broad class to which this work assigns Bitcoin's price dynamics.
Ponzi scheme
A fraud that pays existing investors with new investors' money while concealing the absence of real returns. Defined by deception, not by the funding mechanism itself.
This document is an educational explainer, not financial, legal, or investment advice. All prices, rates, and balance-sheet figures are illustrative and reflect conditions as of mid-2026; they change continuously. Do your own research and consult a licensed professional before making any investment decision.